2006.18.5.59
·
Item
·
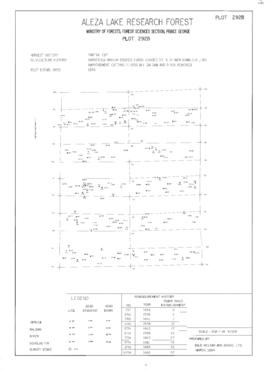
Mar. 1994
Part of Aleza Lake Research Forest Society fonds
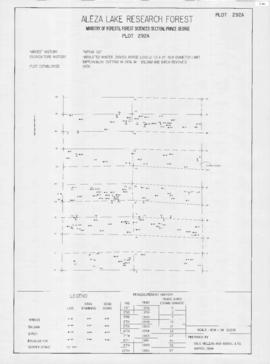
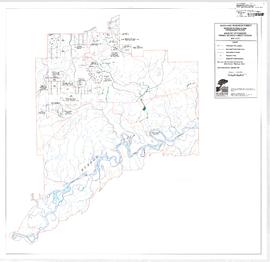
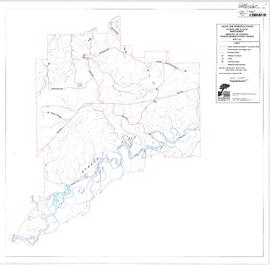
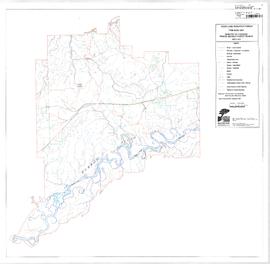
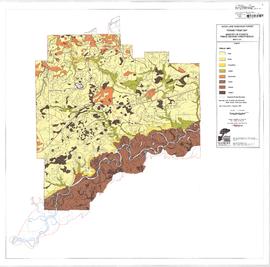
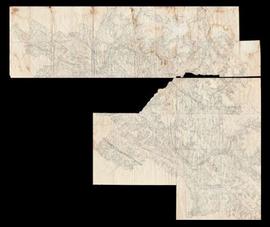
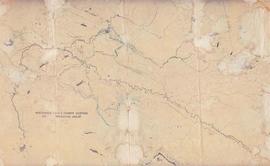
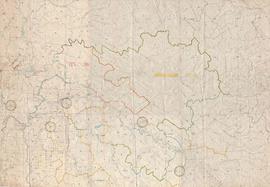
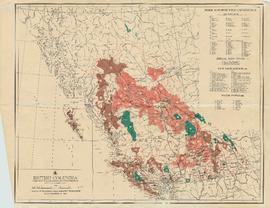
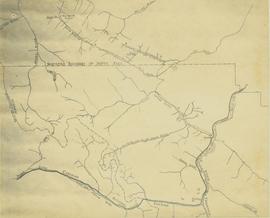
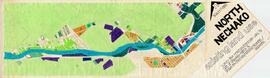
Mylar map is a plot map of a research plot at the Aleza Lake Research Forest. Provides date the plot was established, the harvest history, the silviculture history, remeasurement history, and information about individual trees.