2007.1.80.1.19
·
Item
·
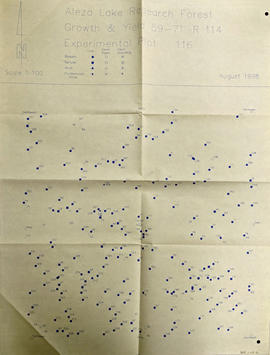
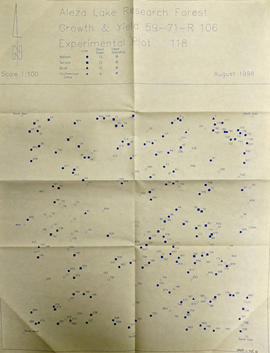
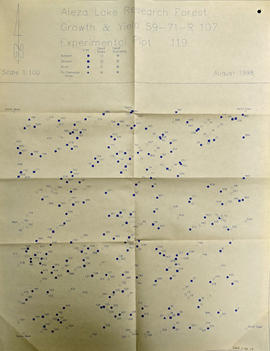
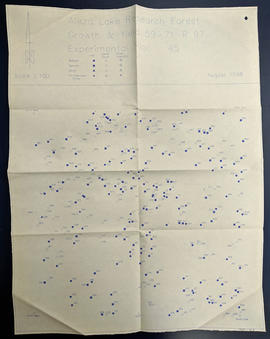
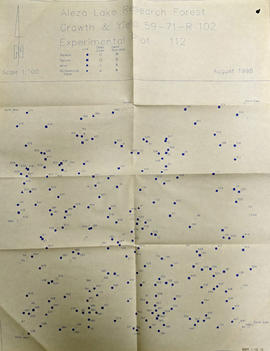
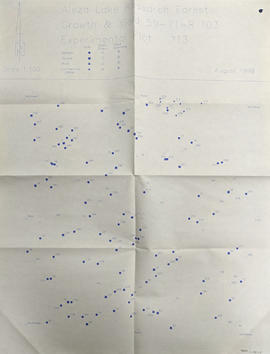
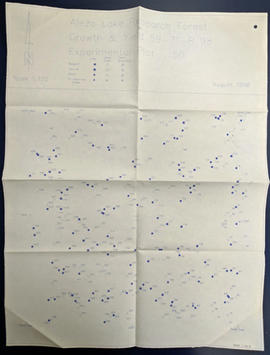
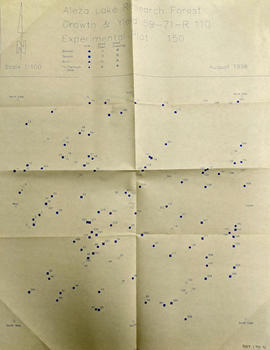
Sept. 1998
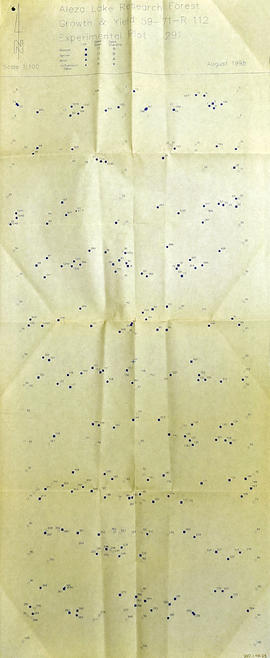
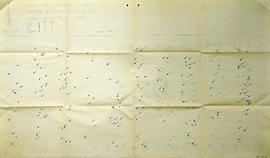
Part of Aleza Lake Research Forest fonds
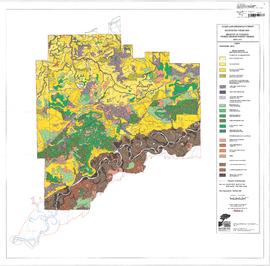
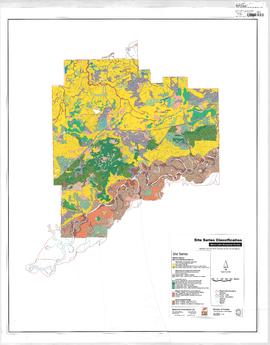
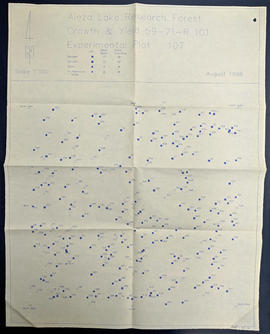
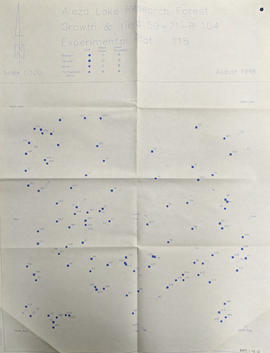
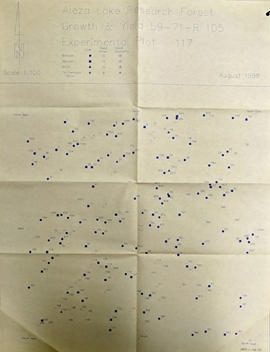
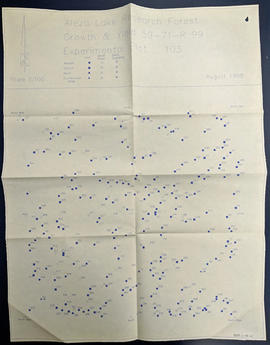
Map commissioned from Ministry of Forests Prince George Region from Madrone Consultants shows Aleza Lake Research Forest ecosystems. Map is 5 of 6. Map shows many sub-types of the following ecosystem types: upland, lowland wet forest, wetlands, and the Bowron floodplain benches. Ecosystem classification and mapping by Oikos Ecological Services Ltd.
![City of Prince George - Schedule B of the Official Community Plan, Bylaw No. 5909 [1998 Amendment]](/uploads/r/northern-bc-archives-special-collections-1/d/6/d/d6d1c4e7e37fc948b97b3caa36447b52f7d2b76b13d45e3710aefee7b13840f0/2023.5.1.33_-_1998_Official_Community_Plan_City_of_PG_JPG85_tb_142.jpg)
![City of Prince George - Schedule B of the Official Community Plan, Bylaw No. 5909 [2001 Amendment]](/uploads/r/northern-bc-archives-special-collections-1/c/3/6/c36392b90696286cc6281e8cc2efbf7691c2617726495fa28db2cbdcc20e4e4c/2023.5.1.36_-_Official_Community_Plan_City_of_PG_Schedule_B_2001_JPG85_tb_142.jpg)
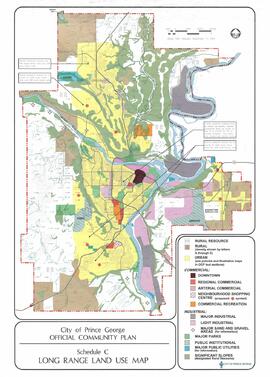
![City of Prince George - Schedule C of the Official Community Plan - Long Range Land Use Map [October 2006 Amendment]](/uploads/r/northern-bc-archives-special-collections-1/6/d/6/6d643c10801eba2ac493689972e57429dba42ec7592f54cb55151b96362d7048/2023.5.1.40_-_2006_Oct_-_City_of_Prince_George_Long_Range_Land_Use_Map_JGP85_tb_142.jpg)
![City of Prince George - Schedule C of the Official Community Plan - Long Range Land Use Map [May 2006 Amendment]](/uploads/r/northern-bc-archives-special-collections-1/6/5/5/65536bc04aa97580c140131651dc357dfe5c3a1315822394f388d96940bc39cb/2023.5.1.39_-_2006_May_-_City_of_Prince_George_Long_Range_Land_Use_Map_JPG85_tb_142.jpg)
![City of Prince George - Schedule C of the Official Community Plan - Long Range Land Use Map [May 2008 Amendment]](/uploads/r/northern-bc-archives-special-collections-1/4/3/a/43a9e75941f1542735d999de340307d163e79dffdadbf4546bb9346b63f7e734/2023.5.1.41_-_2008_May_-_City_of_Prince_George_Long_Range_Land_Use_Map_JPG85_tb_142.jpg)