2006.18.5.28
·
Item
·
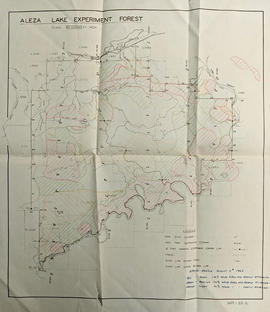
[1992?]
Part of Aleza Lake Research Forest Society fonds
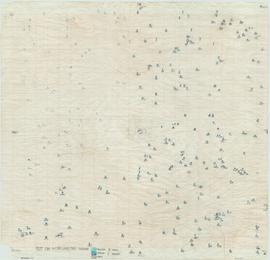
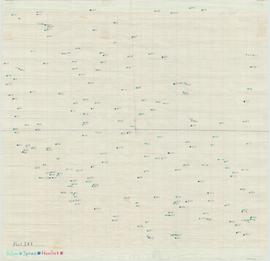
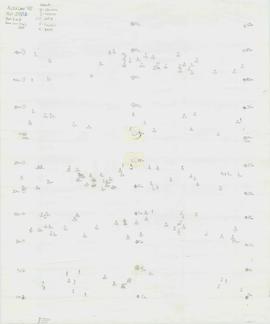
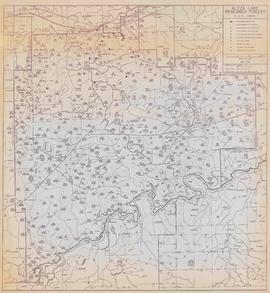
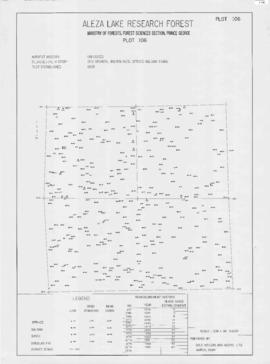
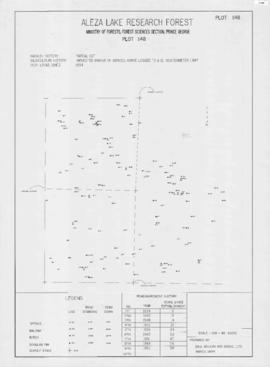
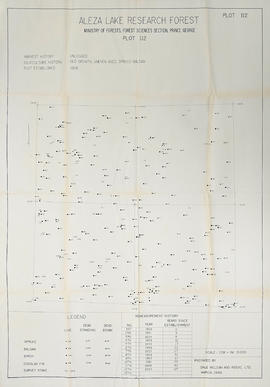
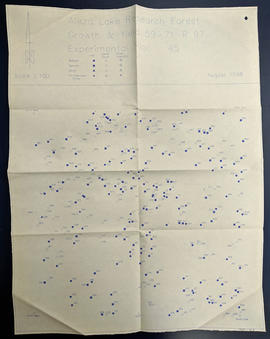
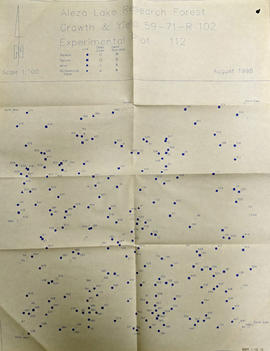
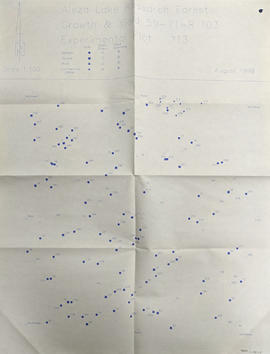
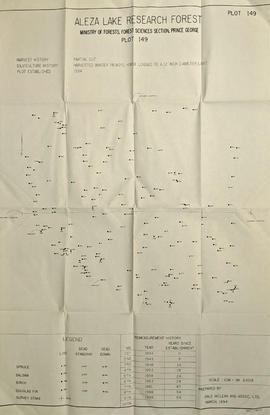
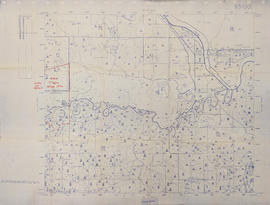
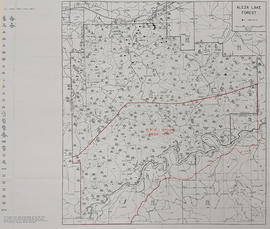
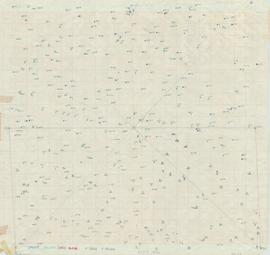
Item is a hand-drawn map of a plot in the Aleza Lake Research Forest. Individual trees are marked and numbered.